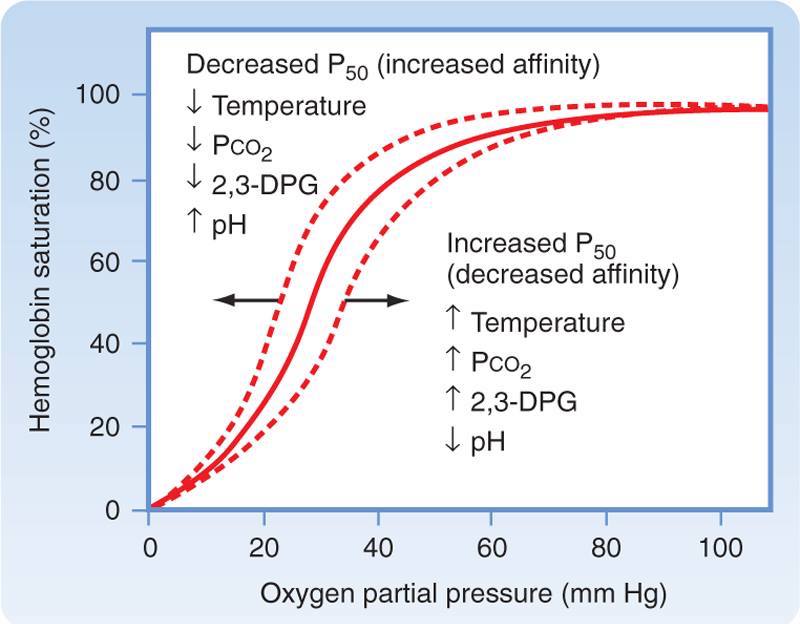
The oxygen dissociation curve is a graphical representation of the relationship between the partial pressure of oxygen (PO₂) and the percentage saturation of haemoglobin with oxygen (SO₂). This curve is crucial in understanding how readily haemoglobin acquires and releases oxygen molecules into the tissues.
Right Shift (Decreased Affinity for Oxygen)-Facilitating O2 unloading
Left Shift (Increased Affinity for Oxygen)– Increase affinity of Hb for O2
CADET -Face right (↑ Co2, Acidity, 2,3 DPG, Exercise, Temp ) cause right shift
Oxygen Dissociation Curve
- Shape of the Curve:
- The curve is sigmoidal (S-shaped) due to the cooperative binding of oxygen to haemoglobin. This means that the binding of one oxygen molecule to haemoglobin increases its affinity for the next oxygen molecule.
- Key Points on the Curve:
- P50 Value: The partial pressure of oxygen at which haemoglobin is 50% saturated with oxygen, typically around 26-27 mmHg in humans.
- Plateau Region: At higher PO₂ levels (like in the lungs, around 100 mmHg), haemoglobin is nearly 100% saturated.
- Steep Region: At lower PO₂ levels (like in tissues, around 40 mmHg), haemoglobin releases oxygen more readily.
Factors Affecting the Oxygen Dissociation Curve
The position and shape of the oxygen dissociation curve can shift due to various factors, which affect haemoglobin’s affinity for oxygen. These shifts can be either to the right (decreased affinity) or to the left (increased affinity).
Right Shift (Decreased Affinity for Oxygen):
Right Shift (Decreased Affinity for Oxygen):
- pH:
- Effect: Lower pH (more acidic) shifts the curve to the right, promoting oxygen release at the tissue level (Bohr effect). This is because acidic conditions favour the conversion of haemoglobin to the deoxyhaemoglobin form (Hb), releasing bound oxygen.
- Physiological Significance: As tissues metabolise oxygen and generate carbon dioxide, they become more acidic. The rightward shift due to lower pH facilitates oxygen unloading in these active tissues.
- pCO2 (Carbon Dioxide Pressure):
- Effect: Higher pCO2 (more carbon dioxide) also shifts the curve to the right, similar to the Bohr effect.
- Physiological Significance: Increased CO2 levels often accompany increased metabolic activity and tissue oxygen demand. The rightward shift due to higher pCO2 ensures sufficient oxygen delivery to meet cellular needs.
- Temperature:
- Effect: Higher temperature shifts the curve to the right, promoting oxygen release.
- Physiological Significance: During exercise or fever, body temperature rises. The rightward shift due to increased temperature allows for greater oxygen delivery to meet the body’s elevated metabolic demands.
- 2,3-Diphosphoglycerate (2,3-DPG):
- Effect: Higher 2,3-DPG levels shift the curve to the right, favoring oxygen release. 2,3-DPG is a molecule produced by red blood cells that binds to haemoglobin, reducing its affinity for oxygen.
- Physiological Significance: 2,3-DPG levels can be influenced by factors like altitude and certain medical conditions. At high altitudes where pO2 is low, the body increases 2,3-DPG production to enhance oxygen unloading in tissues.
- The plateau at the top indicates high oxygen saturation at high PO₂ (e.g., in the lungs).
- The steep portion indicates a rapid drop in saturation with small decreases in PO₂ (e.g., in the tissues).
Clinical Significance
- Right Shift: Facilitates oxygen unloading to tissues during states of high metabolic activity, exercise, fever, or acidosis.
- Left Shift: Enhances oxygen loading in the lungs but can impair oxygen delivery to tissues, as seen in hypothermia or alkalosis.
Summary
- Right Shift Factors: Increased CO₂, decreased pH, increased temperature, increased 2,3-BPG.
- Left Shift Factors: Decreased CO₂, increased pH, decreased temperature, decreased 2,3-BPG.
Understanding these shifts and their causes helps in managing various physiological and pathological conditions, ensuring proper oxygen delivery and utilisation in the body.
