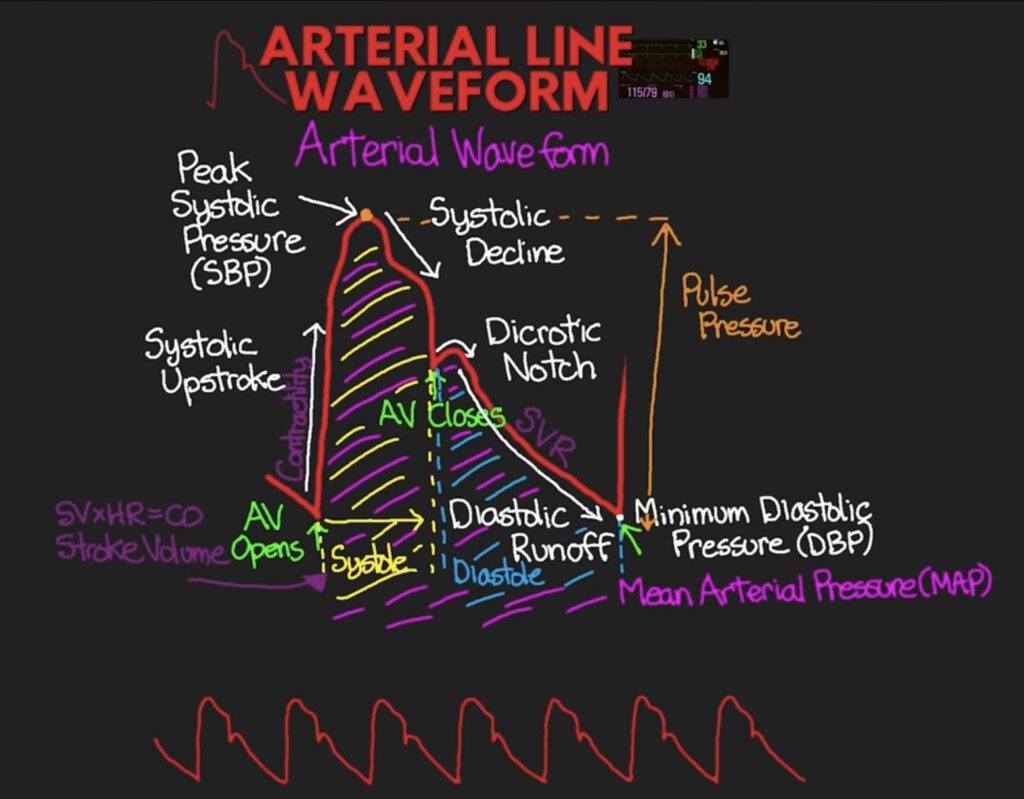
Interpreting an arterial line (art line) involves understanding the various components of the waveform, which represent different phases of the cardiac cycle. Here’s a detailed explanation of the steps of an arterial line waveform:
Positioning and Calibration
- Transducer Leveling:
- The transducer should be leveled at the phlebostatic axis (the midpoint of the left atrium, usually at the fourth intercostal space, mid-axillary line) to ensure accurate pressure readings.
- Zeroing the Transducer:
- Regularly zero the transducer to atmospheric pressure to eliminate drift and ensure accuracy.

Components of the Waveform
- Systolic Upstroke:
- Description: This is the rapid upward slope of the waveform.
- Significance: It represents the forceful ejection of blood from the heart’s left ventricle into the aorta during systole (contraction).
- Clinical Insight: A steep upstroke indicates good left ventricular function, while a slow upstroke may indicate left ventricular dysfunction or stenosis.
- Systolic Peak:
- Description: The highest point on the waveform.
- Significance: Indicates the peak pressure in the aorta during systole.
- Clinical Insight: This corresponds to the systolic blood pressure (SBP). Elevated peaks may indicate hypertension, while low peaks can suggest hypotension or reduced cardiac output.
- Systolic Decline:
- Description: The downward slope following the systolic peak.
- Significance: Represents the decrease in pressure as blood flows out of the aorta and into the peripheral arteries.
- Clinical Insight: A rapid decline is normal, whereas a slow decline may indicate peripheral arterial resistance or obstructions.
- Dicrotic Notch:
- Description: A small notch on the downward slope.
- Significance: Caused by the closure of the aortic valve at the end of systole.
- Clinical Insight: The presence of the dicrotic notch confirms the proper timing of aortic valve closure. Absence or damping of the notch can indicate aortic valve problems or damping of the waveform.
- Diastolic Run-off:
- Description: The slow decline of the waveform towards the baseline.
- Significance: Represents the pressure in the aorta during diastole (relaxation) of the heart ventricles.
- Clinical Insight: This phase shows how the arterial pressure gradually decreases as blood flows into the peripheral circulation. The slope of this decline can give insights into systemic vascular resistance.
- End-Diastolic Pressure:
- Description: The lowest point on the waveform just before the next systolic upstroke.
- Significance: Indicates the minimum pressure in the aorta.
- Clinical Insight: This corresponds to the diastolic blood pressure (DBP). Low end-diastolic pressure can suggest good arterial compliance or low systemic resistance, while high end-diastolic pressure can indicate high systemic resistance or arterial stiffness.
Assessing Waveform Morphology
- Normal Waveform:
- A well-defined systolic upstroke, clear dicrotic notch, and gradual diastolic decline.
- Flattened Waveform:
- May indicate hypotension or a dampened waveform due to catheter kinking or obstruction.
- Exaggerated Waveform:
- High peaks and low troughs may indicate hypertension or a hyperdynamic circulatory state.
Troubleshooting Common Issues
- Damped Waveform:
- Indicates a reduction in the amplitude of the waveform, often due to air bubbles, clots, or kinks in the line. It may also occur if the transducer is not leveled correctly.
- Overdamped Waveform:
- Appears as a slurred upstroke and absence of the dicrotic notch. It is usually caused by excessive damping due to air bubbles or very compliant tubing.
- Underdamped Waveform:
- Shows exaggerated high and low peaks. It can result from stiff or overly long tubing and can lead to inaccurate pressure readings.
Clinical Applications
- Hypertension: High systolic peaks and elevated diastolic pressures.
- Hypotension: Low systolic peaks and reduced diastolic pressures.
- Shock: Altered waveform patterns indicating compromised perfusion.
- Valvular Heart Disease: Abnormalities in the dicrotic notch and waveform morphology.
- Cardiac Arrest: Sudden flattening of the arterial line waveform. Indicates a cessation of effective cardiac output and blood flow
References
- NHS – Arterial Lines: NHS
- BMJ – Arterial Blood Pressure Monitoring: BMJ
- Oxford Academic – Understanding Arterial Lines: Oxford Academic
